
Queensland Art Gallery Board of Trustees Annual Report 2013–14
FINANCIAL STATEMENTS
PART B
6
6
Queensland Ar t Gallery Board of Trustees
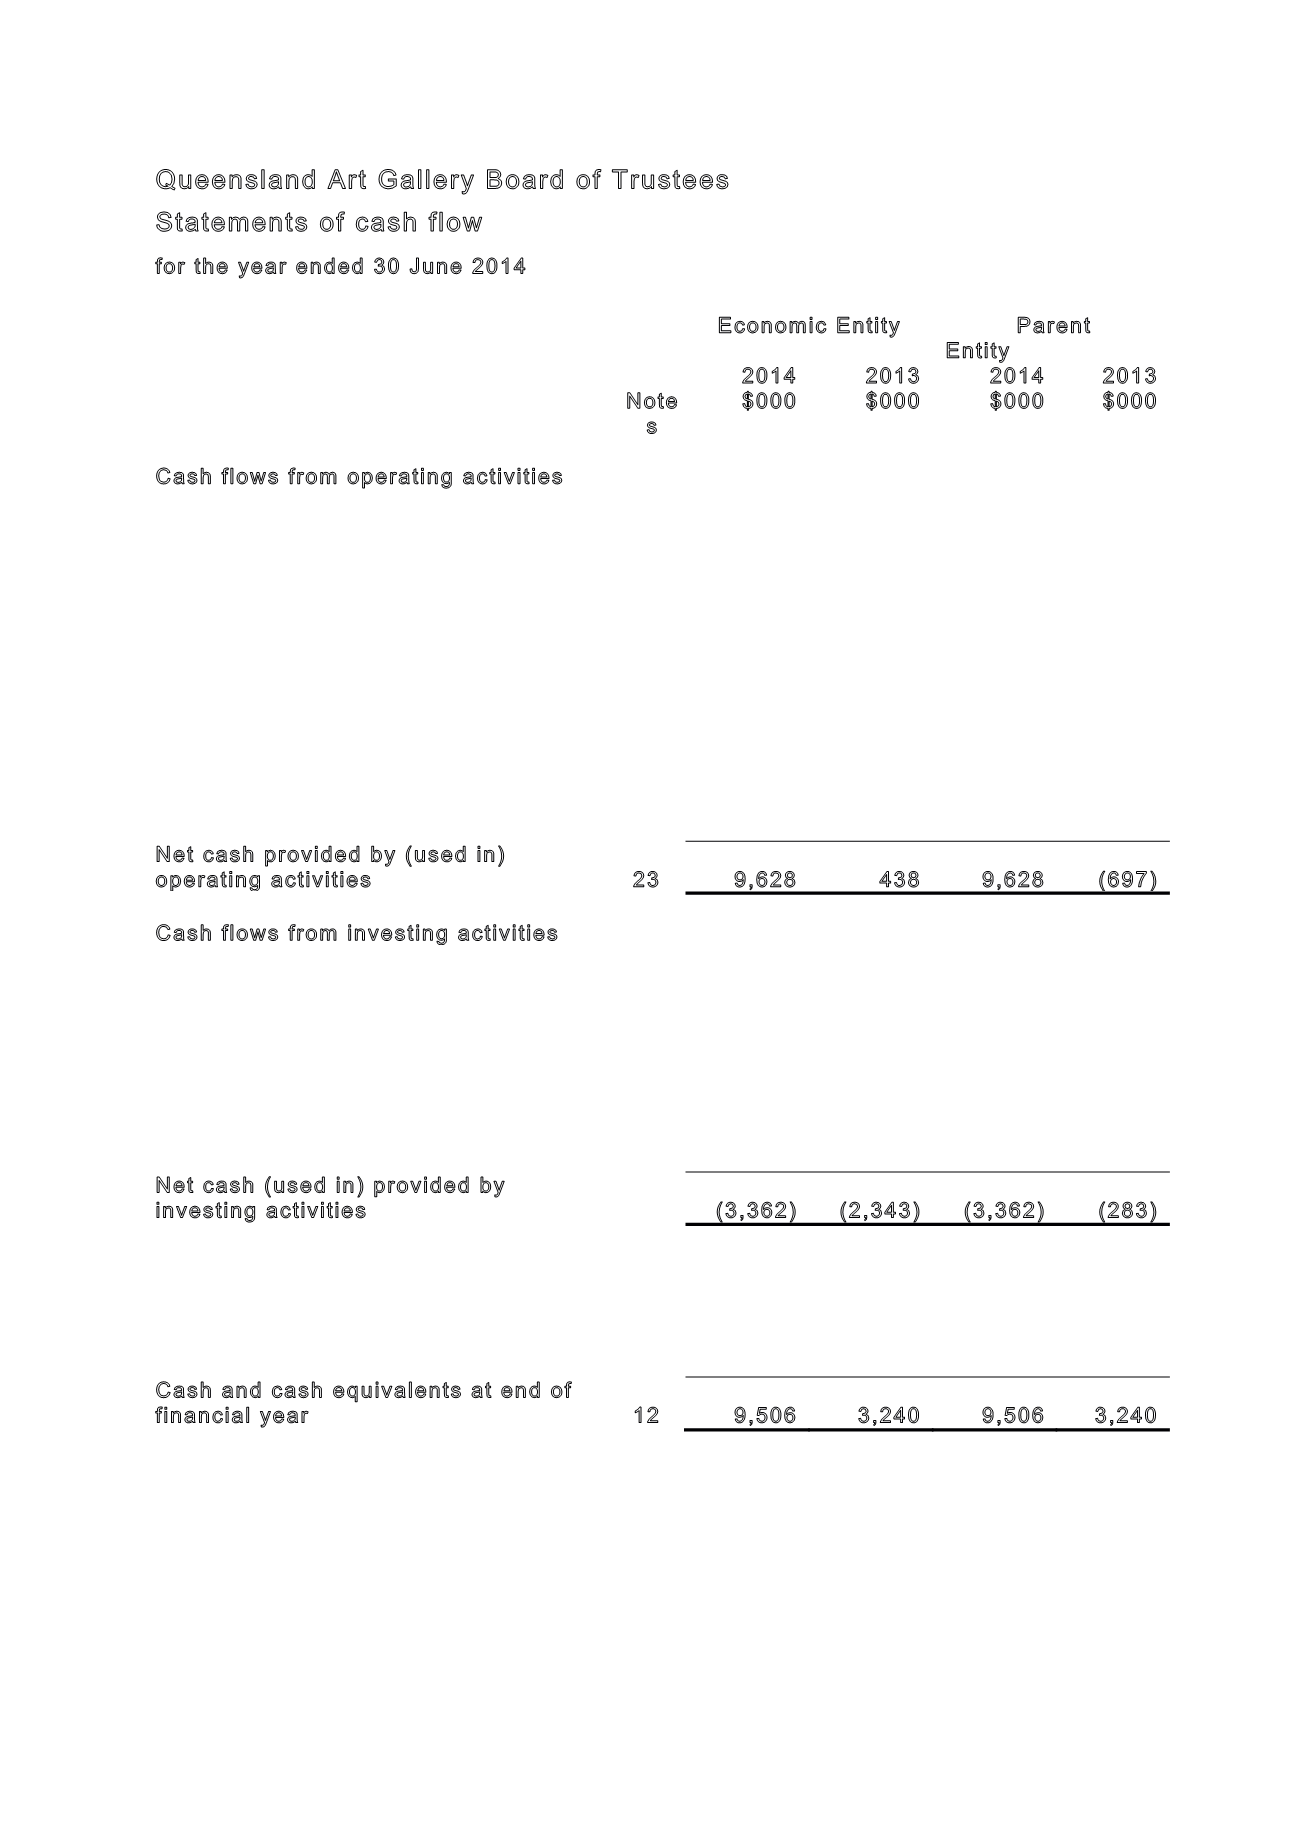
Statements of cash flow
for the year ended 30 June 2014
Economic Entity
Parent
Entity
2014
2013
2014
2013
Note
s
$000
$000
$000
$000
Cash flows from operating activities
Inflows:
Grants and other contributions
38,822
35,084
38,822
35,200
User charges and fees
10,416
9,775
10,416
9,787
Interest receipts
424
666
424
394
GST collected from customers
905
993
905
987
GST input tax credits from ATO
1,378
1,598
1,378
1,585
Other
486
212
486
74
Outflows:
Employee expenses
(25,149)
(26,604)
(25,149) (26,604)
Supplies and services
(14,927)
(18,034)
(14,927) (17,994)
Grants and subsidies
(10)
(11)
(10)
(511)
GST paid to suppliers
(1,367)
(1,496)
(1,367)
(1,484)
GST remitted to ATO
(899)
(987)
(899)
(981)
Other
(451)
(758)
(451)
(1,150)
Net cash provided by (used in)
operating activities
23
9,628
438
9,628
(697)
Cash flows from investing activities
Inflows:
Investments redeemed
2,000
6,020
2,000
1,038
Sales of property, plant and equipment
-
24
-
24
Net cash received upon wind-up of
Queensland Art Gallery Foundation
-
-
-
623
Outflows:
Payments for investments
(1,711)
(6,143)
(1,711)
-
Payments for property, plant and
equipment
(3,652)
(2,244)
(3,652)
(1,968)
Net cash (used in) provided by
investing activities
(3,362)
(2,343)
(3,362)
(283)
Net increase (decrease) in cash and cash
equivalents
6,266
(1,905)
6,266
(980)
Cash and cash equivalents at beginning of
financial year
3,240
5,145
3,240
4,220
Cash and cash equivalents at end of
financial year
12
9,506
3,240
9,506
3,240
The accompanying notes form part of these statements.


