
Queensland Art Gallery Board of Trustees Annual Report 2013–14
FINANCIAL STATEMENTS
PART B
32
32
Queensland Ar t Gallery Board of Trustees
Notes to and forming par t of the Financial Statements 2013–14
28. Financial Instruments (cont.)
(d) Liquidity Risk (cont.)
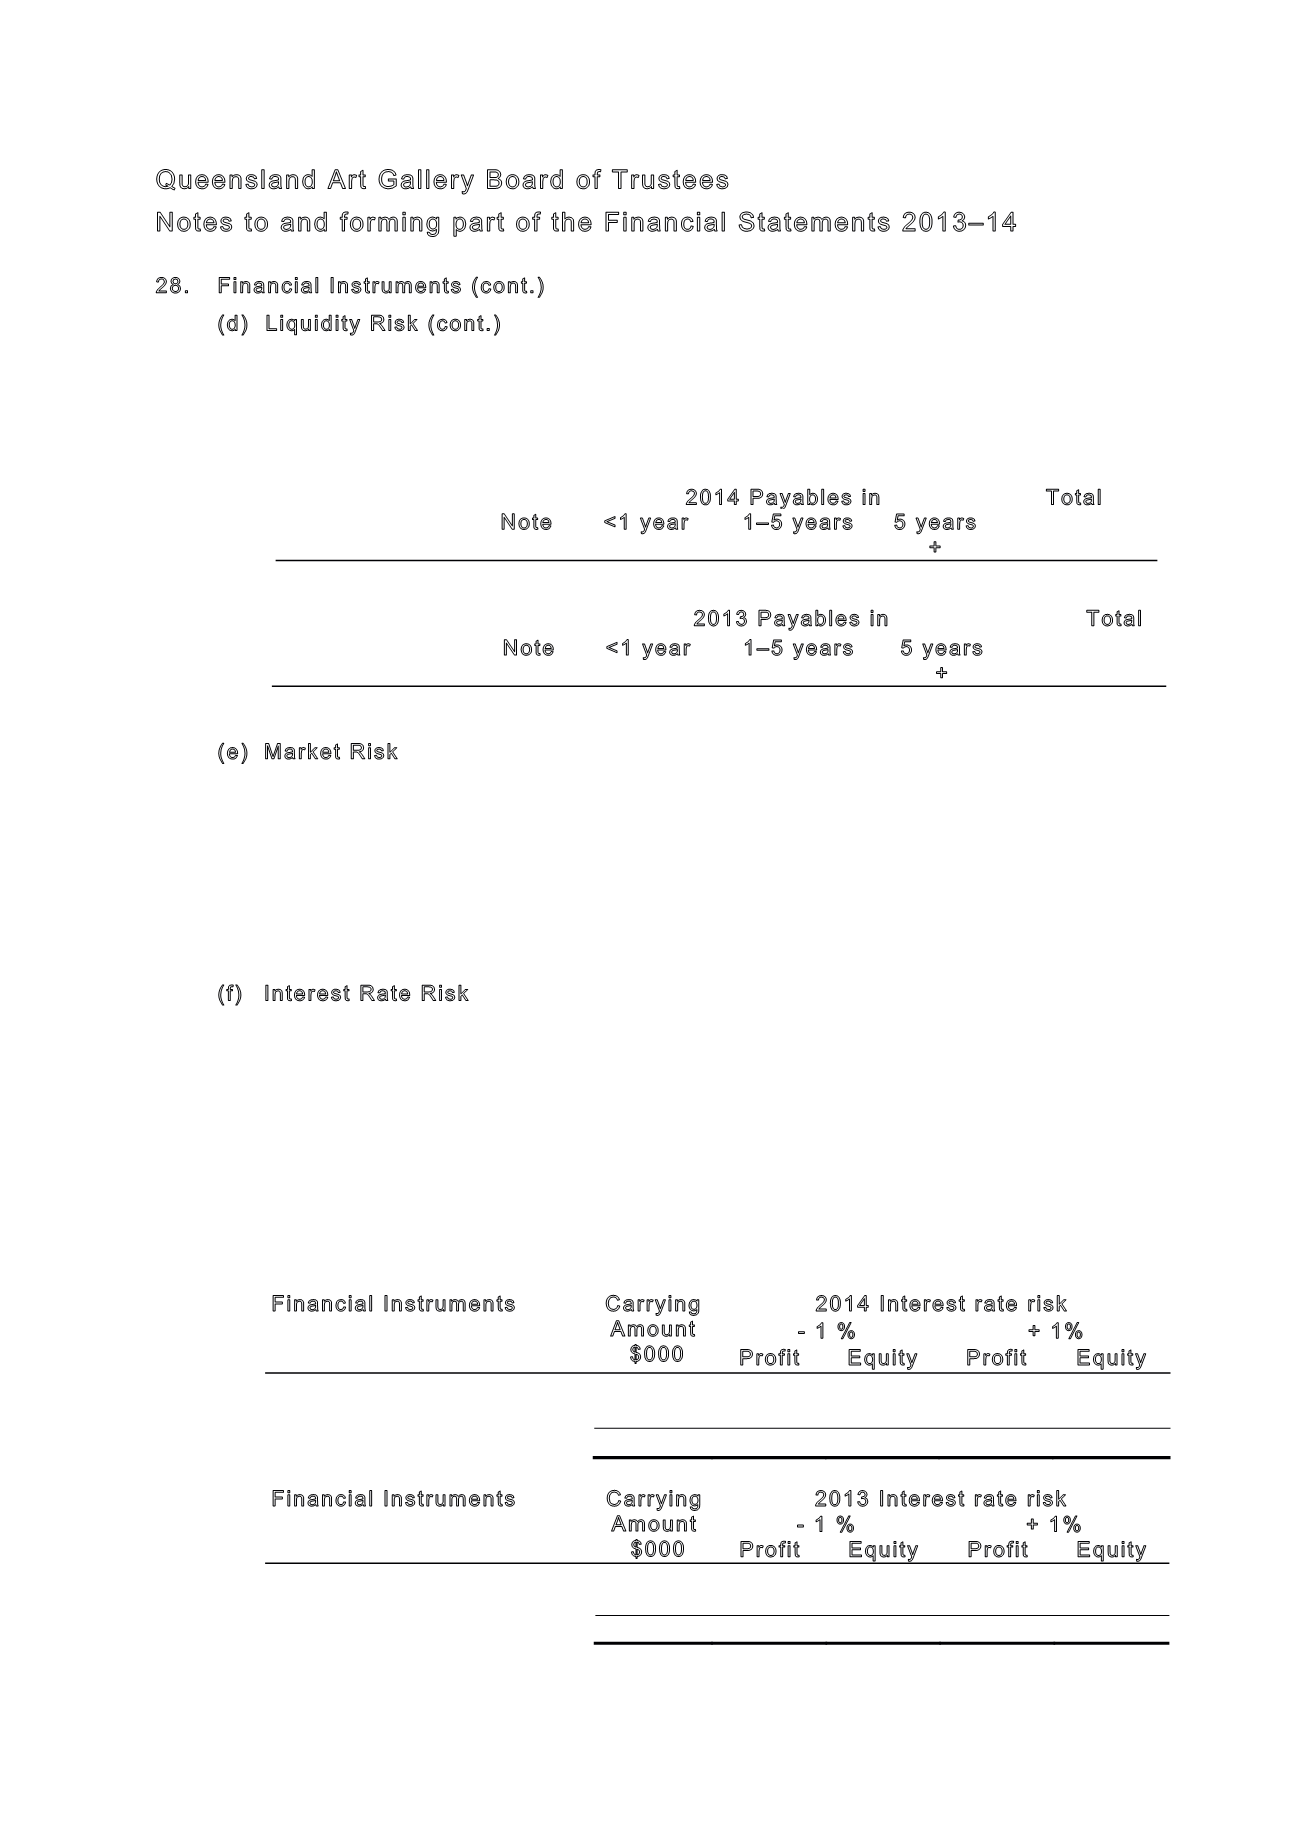
The following table sets out the liquidity risk of financial liabilities held by the Gallery. It
represents the contractual maturity of financial liabilities, calculated based on cash flows
relating to the repayment of the principal amount outstanding at balance date.
Maximum exposure to liquidity risk:
(e) Market Risk
The Gallery is exposed to foreign currency exchange risk only to the extent that some
contracts, mainly exhibition contracts and art acquisition contracts, are in foreign currency.
As far as possible, the Gallery minimises this risk by negotiating contracts in Australian
dollars and by keeping payment terms short. Where this is not possible and the amount is
material, the Gallery may offset foreign currency exchange risks by holding foreign
currency when approved by the Treasurer under the
Statutory Bodies Financial
Arrangements Act
1982. The Gallery is not currently holding foreign exchange reserves for
this purpose.
(f) Interest Rate Risk
The Gallery is exposed to interest rate risk through cash deposited in interest-bearing
accounts. The Gallery does not undertake any hedging in relation to interest risk. Interest
returns on investments are managed in accordance with the Gallery’s investment policies.
The following interest rate sensitivity analysis is based on a report similar to that which
would be provided to management, depicting the outcome to profit and loss if interest
rates changed by +/-1% from the year-end rates applicable to the Gallery’s financial
assets and liabilities. With all other variables held constant, the Gallery would have a
reserves and equity increase/(decrease) of $315,000 (2013: $237,000). This is
attributable to the Gallery's exposure to variable interest rates on interest-bearing cash
deposits.
Financial Instruments
Carrying
Amount
$000
2014 Interest rate risk
- 1 %
+ 1%
Profit
Equity
Profit
Equity
Cash and Cash Equivalents
9,506
(95)
(95)
95
95
Other Financial Assets
21,968
(220)
(220)
220
220
Overall effect on profit and loss
31,474
(315)
(315)
315
315
Financial Instruments
Carrying
Amount
$000
2013 Interest rate risk
- 1 %
+ 1%
Profit
Equity
Profit
Equity
Cash and Cash Equivalents
3,240
(32)
(32)
32
32
Other Financial Assets
20,476
(205)
(205)
205
205
Overall effect on profit and loss
23,716
(237)
(237)
237
237
2014 Payables in
Total
Note
<1 year
1–5 years
5 years
+
Payables
17
2,150
-
-
2,150
2013 Payables in
Total
Note
<1 year
1–5 years
5 years
+
Payables
17
1,585
-
-
1,585


